State Health System Report Card Shows Poor Progress in Recent Years
Abstract
The top-performing states—Minnesota, Massachusetts, New Hampshire, Vermont, and Hawaii—lead the nation across most dimensions of care.

From 2007 to 2012, access to health care deteriorated for adults, costs increased, and disparities in performance across and within states persisted along with widespread evidence of poor care coordination.
Those were key findings from the Commonwealth Fund’s “Scorecard on State Health System Performance, 2014.” The scorecard assesses states on 42 indicators of health care access, quality, costs, and outcomes during a period that included the recession and before enactment of the Affordable Care Act. Changes in health system performance were mixed overall, with states making progress on some indicators while losing ground on others.
In a few areas that were the focus of national and state attention—childhood immunizations, hospital readmissions, safe prescribing, and cancer deaths—there were widespread gains. But more often than not, states exhibited little or no improvement.
The Commonwealth Fund’s scorecard is a dense trove of statistical information that evaluates 42 key indicators grouped into four dimensions:
Access and Affordability (six indicators): includes rates of insurance coverage for children and adults, as well as individuals’ out-of-pocket expenses for medical care and cost-related barriers to receiving care. | |||||
Prevention and Treatment (16 indicators): includes measures of receiving preventive care and the quality of care in ambulatory, hospital, long-term-care, and postacute settings. | |||||
Potentially Avoidable Hospital Use and Cost (nine indicators, with one indicator, hospital admissions for ambulatory care–sensitive conditions, reported separately for two distinct age groups): includes indicators of hospital use that might have been reduced with timely and effective care and follow-up care, as well as estimates of per-person spending by Medicare beneficiaries and the cost of employer-sponsored insurance. | |||||
Healthy Lives (11 indicators): includes indicators that measure premature death and health risk behaviors. | |||||
“The mixed performance of states’ health systems over the five years preceding implementation of the Affordable Care Act’s major reforms sends a clear message that states and the nation are still a long way from becoming places where everyone has access to high-quality, affordable care and an equal opportunity for a long and healthy life,” said David Radley, Ph.D., M.P.H., a senior scientist at the Institute for Healthcare Improvement in Boston, and colleagues. The scorecard, they said, “finds that, on a significant majority of measures, the story is mostly one of stagnation or decline. In most parts of the country, performance worsened on nearly as many measures as it improved.”
In assessing change over five years beginning in 2007, the Commonwealth Fund Scorecard found persistent geographic disparity in the performance of state health care systems as well as variation in rates of change. These variations may partly reflect differences in state policies and funding of health care programs such as Medicaid, as well as in local norms and practices. Several themes stand out:
There were some improvements in state health system performance in recent years, but widespread gains remained the exception. On two-thirds of the 42 indicators there was no meaningful improvement or decline in performance in most states. On nine of the 42, meaningful improvement occurred in a majority of the states. Colorado, Maryland, New Hampshire, and New York stand out for net improvement across indicators. | |||||
Most states improved on indicators that have been the focus of national and state attention, including immunizations for children, safe prescribing of medications for the elderly, patient-centered care in the hospital, avoidable hospital admissions and readmissions, and cancer-related deaths. | |||||
Lower premature mortality rates, including lower rates of cancer-related death, suggest that improvements in medical care are contributing to better health outcomes. Fifteen states saw meaningful reductions on each of two measures of premature death (mortality amenable to health care and years of potential life lost), but even greater progress may be possible through health system improvement. | |||||
States lost ground in insurance coverage for adults and affordability of care. | |||||
Troubling disparities and gaps in care persisted for children and other vulnerable populations. There have been some promising gains in recent years, such as a lower rate of asthma hospitalizations. But troubling declines on other health care indicators, such as the proportion of children with a primary care “medical home,” emphasize the need for continued diligence to secure the health of future generations. | |||||
Disparities in health care and outcomes remained wide between vulnerable and more-advantaged groups within all states. While states made progress in reducing disparities in premature mortality and other key indicators, disparities widened for others, such as poor health-related quality of life. | |||||
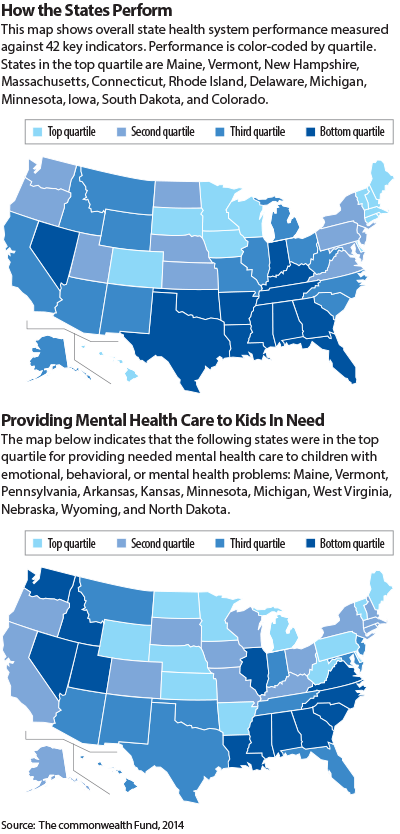
Widespread geographic variations in health system performance persist, providing benchmarks and illustrating opportunities to do better. The top-performing states—Minnesota, Massachusetts, New Hampshire, Vermont, and Hawaii—lead the nation across most dimensions of care and have done so over time (see map). Their consistently high performance may be the result of their willingness and resources to address health system change with focused initiatives spanning the public and private sectors, the authors said.
For a summary of key findings regarding overall performance, see box on page 16.
Among the many variables looked at in the report is whether children with emotional, behavioral, or developmental problems received needed mental health care from 2011 to 2012. On that variable, the report’s interactive map indicates the following states were in the top quartile for providing needed mental health care to children in need: Maine, Vermont, Pennsylvania, Arkansas, Kansas, Minnesota, Michigan, West Virginia, Nebraska, and Wyoming. States in the bottom quartile included Washington, Idaho, Nevada, Utah, Illinois, Louisiana, Alabama, Mississippi, Georgia, South Carolina, North Carolina, and Virginia. ■
The Commonwealth Fund report along with charts, PowerPoints, and interactive maps can be accessed here.


